RSS

Central Banks Balance Sheet Assets Versus Greater Vancouver Real Estate

Massive global credit expansion by the Central Banks around the world after the financial collapse in 2007 had a major impact on the asset prices for stocks, bonds and real estates around the world. 


Central Banks Balance Sheet Assets

Credit growth from 2006 to 2018 was a massive $17 trillions, representing over 440% increase over a 12 years period.


Greater Vancouver real estate price growth over the same period was around 272%, presenting a 22.7% growth each year for 12 years. Knowing the fact that the real estates around the world are directly affected by global credits and interest rates, close monitoring on credit growth and interest rates will help to foretell the performance of Greater Vancouver's housing market. 


Metro Vancouver price chart

BC Housing Measures

The early 2018 BC Government's housing policy measures include:

  • A speculation tax aimed at absentee property owners that was targeted at homeowners who don’t pay much income tax in B.C.
  • A hike to the foreign buyers’ tax from 15 to 20 per cent, and expanding it to areas including Victoria, Nanaimo, the Fraser Valley and the Okanagan
  • A property transfer tax (PTT) hike for homes worth more than $3 million
  • A registry that would record contract assignments in the pre-sale market

Detached home prices deteriorated further in 2018, and the market sentiment for townhouse and condo buyers turned sour during the second half of 2018.

Home Sales Versus Home Prices

Greater Vancouver Home Sales

When the rise in home prices for Greater Vancouver is compared to total home sales, the only time period when the price chart appeared to correspond to the price gain was from 2013 to 2016. Detached homes made huge price gains from 2009 to the end of 2017, while townhouses and condos made significant gains in values from 2015 to the middle of 2018.


REGBV home sales forecast 2019, 2020


The East Vancouver housing market is an early indicator for the general health of the housing market in the lower mainland of Vancouver. Total home sales may have reached its lowest level after suffering lower sales for 2.5 years.


Detached home prices had dropped about 8% compared to a year ago, and the outlook is not good for a quick turn around. The price gain for detached homes from 2013 to 2017 was an impressive 196%. The price decline for detached homes on the way down, if it is a moderate decline, could take the current price level lower by another 10% to 15%.


Townhouses and condos had so far suffered about 2% drop in value, compared to the previous month. Their prices were still about 2.5% higher than a year ago. However, if market sentiment continues to deteriorate, the lack of buying interest may result in townhouse and condo prices dropping 5% to 10% from current levels.


Related Posts:


Housing Market Insight

- October Home Sales Report - REBGV

- Home Sales Dropped 43.5% In September

Read


Total Metro Vancouver homes sales were down across all property types.

The Real Estate Board of Greater Vancouver (REBGV) reported that the regional residential home sales totalled 1,608 for Novermber were 42.5% lower than November 2017.


The total sales for the month were 34.7 per cent below the 10-year November sales average and it was the lowest sales for the month since 2008. Read the full report here.


The total number of homes listed for sale on the MLS® system in Metro Vancouver at 12,307 was a 40.7% increase compared to November 2017 (8,747), and a 5.2 per cent decrease compared to October 2018 (12,984).

The sales-to-active listings ratio for all property types, was 13.1%, with single family detached at 8.9% (Buyer market since June), 14.7% for townhomes, and 17.6% for apartments.


declining home sales and prices as shown by sales to active ratio declining


Generally, when the sales to actives ration is under 12%, pricing pressure favours home buyers, and when the ratio is above 20%, pricing pressure favours sellers. The market is in balance between 12% and 20% sales to actives ratio.

Average Days On Market

The longer the average days on market, the more pricing pressure on sellers and the weaker they can hold on to their selling prices. The increasing number of days from 30 to 40 weakens sellers bargaining power. If the number of days increases further from 40 to 50 days or higher, the market gets from bad to worse for home sellers.


Average days on market all property types

Home Prices Are Rolling Over

Greater Vancouver Price Chart price trending lower


Home prices had declined between 4% to 7% over the last six months depending on property type. The possibility for further price decline is real, as home prices had gone up too high and too fast the past few years. According to Mr. Dane Eitelan, an analyst at Eitel Economics, Vancouver's detached home price was predicted to drop 23% from its 2017 peak (over a period of 2 to 3 years) to bottom out in 2020 or 2021.


Higher interest rates and tightened lending standards had dampened home sales, as many buyers became more cautious and held off their decisions to buy.

High Housing Price Problem

Home buyers from outside Canada have a major impact on house prices in the major Canadian cities like Toronto and Vancouver. These are outliers, or "marginal buyer" - Buyers who are paying huge premiums over the "consensus price" based on previous sales of comparable homes.


Europeans are interested in purchasing real estate in Toronto, because it's close to New York and it's a relatively easy hop across the Atlantic. In Vancouver, these marginal buyers, mostly from mainland China were fueling the rise in home prices the past 10 years. Cash from overseas by these marginal buyers were pushing up home sales and prices. Most of these buyers are rich and successful businessmen in their home countries. They continue to maintain their businesses and homes overseas, while their spouses and/or sometimes just their children are studying in Canada.

Local Home Buyers' Dilemma

Many local home buyers' "fear of missing out", left them with no choice but to join the bidding war during the hot housing market, when homes were selling within days with multiple offers.They just couldn't wait for home prices to come down as the continuous rise in home prices the past 10 years prompted them to enter the market as "they don't want to be left out not buying their homes before home prices go up further". 


Canadian household debt is growing so fast, we’re in uncharted, and dangerous territory. The household debt-to-income ratio by the second quarter of 2018 was reported to have reached 169.1%Most home owners would not have the financial means to deal with a reduction in their household incomes or any unexpected high financial obligations.  


source: tradingeconomics.com


Beside higher interest risk, a drop in home prices in Vancouver could put many home owners who bought their homes during the past 3 years into serious financial troubles. 


Related Posts:


Housing Market Insight

- October Home Sales Report - REBGV

- Home Sales Dropped 43.5% In September

Read

Housing Market Insight

REBGV October home sales dropped 35%, inventory increased
42%…

Is this dip in price a blip, a soft landing, or the bursting of a bubble?


The Real Estate Board of Greater Vancouver home sales data showed a drop of 35% to 1,966 in October compared to the 3,022 sales recorded a year ago. Total sales for the month showed a 23% rebound from 1,595 sales recorded the previous month. Read the full report here.


Home sales via Canadian MLS® Systems edged back by 1.6% in October 2018. Although activity was stronger compared to the first half of 2018, it remained below monthly levels recorded since early 2014. Total Greater Vancouver home sales had been in decline since 2015, with each successive year posting weaker sales. 2018 is expected to register much lower home sales than 2017 for Greater Vancouver and the Fraser Valley.


Greater Vancouver Housing Market

Rising interest rates have prompted the Federal Government pushing for tighter credit standards and Canadian banks adopting more stringent under-writing conditions for home loan applications. The stress testing imposed by Canada’s banking regulator had resulted in many borrowers not able to qualify for the loans they needed for their home purchases.


After reaching peak sales of 42,326 units in 2015, buying interest for Greater Vancouver detached homes took a dive, taking sales down 15% and 21% in 2016 and 2017 respectively. Adding the projected November and December sales of 1,142 units to January to October 2018 total sales of 6,678 homes, 2018 would record 7,820* homes sold, representing 32% fewer detached homes sold compared to 2017. Multi-family townhomes and condos are experiencing slower sales, with both showing accelerated sales decline in the second half of 2018. 

*projection by addding 2 months sales of 1,142 homes (average monthly sale based on August, September and October sales of 567, 508 and 637 homes respectively). 

Greater Vancovuer detached home sales 2007 to 2018

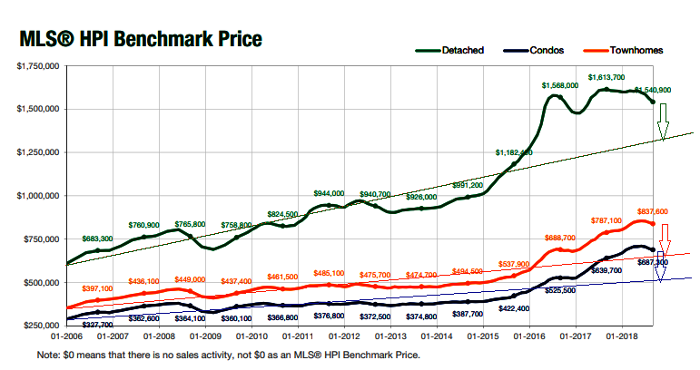
Home Prices Are Weakening

Higher mortgage rates combined with BC government’s housing policies for non-residents and vacancy tax, have resulted in total home sales tumbling to multiyear lows in Greater Vancouver and Fraser Valley. All the above factors have a negetive effect on home sales, resulting in higher supply and lower demand, thereby drving down home prices.


Vancouver Home Sales versus rising interest rates

Single family detached homes for Greater Vancouver had taken the lead in price decline the past 2 years. As of October 2018, its average price at $1,629,000 was 11% lower than its peak price of $1,829,000 reached in May 2017.


According to Mr. Dane Eitelan, an analyst at Eitel Economics, Vancouver's detached home price was predicted to drop 23% from its 2017 peak (over a period of 2 to 3 years) to bottom out in 2020 or 2021.


Multi-family townhome and condo prices are showing signs of rolling over, and if their sales continue to decline, they could follow the price decline as seen for detached homes.  

Bursting Of Vancouver's Housing Bubble?

The material tightening in credit conditions the past 12 months has already taken a lot of velocity out of the housing market that is in decline, and looks to be continuing into decline.


An analyst at Eitel Economics, using a technical-analysis technique commonly used for stock-market analysis was predicting a 23% drop in Vancouver's detached home price from its $1.83M peak to bottom out around $1.4M sometime in 2020 or 2021 (taking 2 to 3 years to hit the bottom of the housing downturn). Read the full article here.

Changes To China's Capitol Control Regulations

Effective January 2 2017, the People’s Bank of China (PBoC) and The State Administration of Foreign Exchange (SAFE) required their citizens exchanging currency greater than ¥200,000 (US$29,000) to provide a declaration to explain the acceptable use of the money. Exchanging currency is now prohibited for buying bonds, “insurance-type” products and real estate. The yearly limit to convert up to US$50,000 per year, per person remains.


New regulations now prohibit the exchange of yuan for real estate, making it tricky to get Chinese Yuan currency into foreign markets. Without Chinese yuan conversion, Chinese buyers won’t be able to continue driving home prices, and could have trouble paying for existing property.


New penalties for lying, or lending one's yearly allowance were also rolled where violators of the policies are now subject to a 3 year ban, and an investigation for money laundering - getting money out of China without an approved use.

Canadian Households Are Highly Indebted

According to the statistics compiled on OECD member countries, Canada has the highest household debt level as a per cent of GDP in the world. And, like every other advanced countries, we are going through incremental interest rate hikes because of higher international cost of capital.


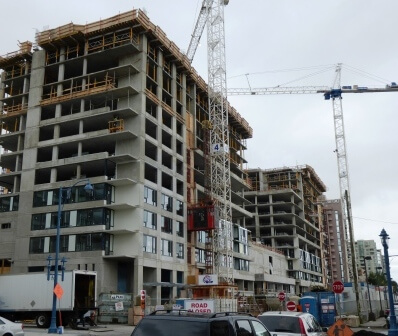
Over-building Of New Condos?

MLA  Advisory, a real estate marketing company, released its most recent insight for Greater Vancouver’s presale housing market, highlighting October as a busy month with the release of 21 presale projects with 2,400 units, compared to October 2017 release of 22 projects with over 1,800 homes. View report here.


In a declining housing market and tightened lending standards, the flow of credit to the housing market is curtailed. Many marginal presale home buyers will have difficulties to get financinng to complete their purchases.


They may not be approved for the loans they needed, or they may be approved for much lower loan amounts for their purchases. These borrowers will have to make the difficult choice, either to stump up the extra cash if they have the excess money, or force to sell their presale homes in a hurry. If this happens en masse, presale home prices can spiral down very quickly.


Will the current dip in price just a blip, a soft landing, or the bursting of a bubble? We will see.

Read

REBGV Home Sales In October

The Real Estate Board of Greater Vancouver (REBGV) reported that residential home sales in the region totalled 1,966 in October 2018, a 34.9 per cent decrease from the 3,022 sales recorded in October 2017, and a 23.3 per cent increase compared to September 2018 when 1,595 homes sold.


Last month’s sales were 26.8 per cent below the 10-year October sales average. Read report here.

Declining Home Sales 

REBGC home sales OCt 2018

Total Greater Vancouver home sales as shown in the chart above, had been declining yearly since 2016 and 2018 sales could end up to be lower than 2008 and 2012. The remaining 2 months of 2018 for November and December, being seasonally low sales months, are not expected to add to many sales to the year.  


The total units of homes sold in the the Greater Vancouver area from January to October 2018 showed close to one-third drop in sales compared to the same period a year ago. The average detached home price for the month registered a decline of 5.1% compared to its price in October, 2017.


October 2018 REBGV home sales


Declining Home Prices

After turning flat-line or declining slightly for the second half of 2017 and the first half of 2018, detached home prices turned down and accelerated in its decline the past  3 months. Both townhouses and condos were showing weakening sales and demand, and October showed signs of decline in their prices. Kindly read the post Home Sales Dropped 43.5% In September.


The excessive credit injection into the housing market the past 10 years had driven home demand and prices to levels far exceeded the ability of home owners to carry their mortgage loan obigations.  

REGBV home sales prices are dropping 

Rising Interest Rates

Interest rates had spiked up considerbly since 2015. After the financial crash of 2008, interest rates were brought down to unpreceedingly low levels from 2009 to 2017.  Since the middle of 2017, the Bank of Canada's Overnight Rate had moved up gradually. Most economists are forecasting that Canada will have to deal with higher interest rates in the coming months.


Compared to the long-term equilibrium rate, the current Bank of Canada overnight rate is still very low. If rates climb another 100 basis points or more, many over-leveraged home owners will face considerable hardships to deal with their mortgage payments.  

Canadian Interest rate October 2018

10-year US Treasury Yield

The 10-year US Treasury yield broke theh 10 years down trend line (in red) and breached the 5 years treasury yield peak around 3%. Mortgage rates are closely linked to the 10-year yield. If the 10-year ticks higher, mortgage costs are going to go higher which will impact the housing market.


Real Estate Cycle

The Canadian housing market, especially detached homes peaked in 2016. Total home sales for 2017 was lower than 2016, and 2018 todate home sales were pointing to an all time low sales, probably lower than that of 2008. Declining detached home sales had resulted in motivated sellers dropping their prices.


Both the resale and presale multi-family markets for townhouses and condos were showing signs market cooling off the past few months. Many more townhomes and condos in recent months were selling below their asking prices compared to early part of the year. Motivated sellers were more willing to sell their homes at much larger discounts from their listing prices.   


We will continue to provide our housing market update to our readers in the coming months.  

Read


Home Sales Dropped 43.5% In September

The Real Estate Board of Greater Vancouver (REBGV) reports that residential property sales in the region totalled 1,595 in September 2018, a 43.5 per cent decrease from the 2,821 sales recorded in September 2017, and a 17.3 per cent decrease compared to August 2018 when 1,929 homes sold.

Last month’s sales were 36.1 per cent below the 10-year September sales average.

“Fewer home sales are allowing listings to accumulate and prices to ease across the Metro Vancouver housing market,” Ashley Smith, REBGV president-elect said.


The September Greater Vancouver home sales was below the 10 years average sale around 2,600 homes. Home sales peaked in spring of 2016 and finished the year with a total of 39,943 homes. Yearly home sales dropped from 2015's total of 42,326 to 39,943 and 35,993 in 2016 and 2017 respectively. The total 2018 home sales from January to September was 29% lower than that of 2017 when only 19,973 sales were registered for 2018 compared to 28,160 sales for the same period in 2017.


If the remaining 3 months of 2018 add another 6,657 homes to the todate sale figure, 2018 would end up with total home sale around 26,630 units which is around 24% lower than 2017's sales of 35,993 homes.  


September Metro Vancouver Home Sales

Rising Insterest Rates

The gradual rise in interest rates since October 2017 dampened home sales, especially single family detached homes. The demand for resale and presale townhouses and condos the past few months had slowed, but interest remain faily strong.


The tightening of mortgage qualification rules by Canadian Banks has a significant effect on home buyers ability to service their loans, thereby reducing the number of home buyer’s qualifying for mortgage loans.

HPI Benchmark Price

The HPI benchmark price for detached homes peaked in May, 2017. Both townhomes and condos reached their peak prices about a year later in July, 2018. The price trend lines for the 3 housing types are showing around 25% over-valuation. This means that home prices could risk substantial price declines if market sentiment turns bad, causing home buyers to stay away from the market. 


According to Mr. Dane Eitelan, an analyst at Eitel Economics, Vancouver's detached home price was predicted to drop 23% from its 2017 peak (over a period of 2 to 3 years) to bottom out in 2020 or 2021.

Housing Forecast For 2019

The British Columbia Real Estate Association is forecasting the housing market in 2019 to remain stable.  Multiple Listing Service (MLS®) residential sales in the province are forecasted to decline 21 per cent to 82,000 units for 2018 compared to 103,768 units sold in 2017, and recover 8% to 88,700 units in 2019.


REBGV is forecasting resale home sales for 2019 and 2020 to stay above 40,000 units.


REGBV home sales forecast 2019, 2020


We hope you will visit our website again soon to learn more about the Greater Vancouver real estate market.


Read
Reciprocity Logo The data relating to real estate on this website comes in part from the MLS® Reciprocity program of either the Greater Vancouver REALTORS® (GVR), the Fraser Valley Real Estate Board (FVREB) or the Chilliwack and District Real Estate Board (CADREB). Real estate listings held by participating real estate firms are marked with the MLS® logo and detailed information about the listing includes the name of the listing agent. This representation is based in whole or part on data generated by either the GVR, the FVREB or the CADREB which assumes no responsibility for its accuracy. The materials contained on this page may not be reproduced without the express written consent of either the GVR, the FVREB or the CADREB.