RSS

Strong Housing Sales Continued In December

Strong December housing activity propelled Metro Vancouver’s* total home sales 53% higher at 30,93 units compared to 2,016 units a year ago. View homes for sale using this link.


Total Home Sales For 2020

The total Metro Vancouver residential home sales for 2020 as reported by the Real Estate Board of Greater Vancouver (REBGV), recorded a total of 30,944 homes which were 22.1% higher than the 25,351 sales recorded in 2019, and a 25.7% increase from the 24,619 homes sold in 2018.


However, the total 2020 residential home sales for Metro Vancouver was 2.8% below the 10-year sales average.

Metro Vancouver Housing Market Outlook For 2021

The most in demand homes for the second half of 2020 were detached homes under $2.0 million. The change in demand for larger homes for families and work-from-home due to the pandemic are driving the demand for single family detached homes from $800,000 to $2.0 million across the region. This demand trend is expected to continue in 2021, and the lack of supply is expected to continue to provide strong support for detached homes.


Similarly, the strong demand for townhouses are expected to continue into 2021.


Soft Condo Market

Although new condo development sales activities showed some signs of improvement, but sales activities are far off from the strong demand as experienced from 2015 to 2018. The condo segment of the housing market is expected to be challenging for 2021. 


We will continue to report back the housing market activities for 2021. If you are planning to buy or sell your home, you are welcome to contact us for a market update and to discuss your plan to buy or sell your home.
 
Read

Greater Vancouver Real Estate Prices Stop Falling, As Sales Jump

The November Greater Vancouver sales figure is in and a somewhat positive headline read "Greater Vancouver Real Estate Prices Stop Falling, As Sales Jump". Read the full article here.


Based on the past seasonal pattern for active listings, we are likely to see a surge in new listings from January 2020 through May to August 2020. The unkown is in buyer interest and home sales for 2020 from January onwards. A likely outcome is moderate home sales as witnessed for 2019. The incentive for buyers to get back into the market in large number is lacking as home prices are still considered too high and not affordable to most home buyers.


At current price levels for all housing types, new condo and townhouses prices in Greater Vancouver selling at $500 to over $800 per sq ft translate into a new townhouse for a young family spending over $675,000 for a 1,350 sq ft home in the suburds of Port Moody and Langley. Closer to the Vancouver in cities like Burnaby and Richmond, such townhosues are priced over $850,000.

What will Be The General Economy For The Market? 


The easing of interest rates the past 3 months help to booster some confidence in the housing market. But, the world economy and the uncertainties caused by the China and US trade war, and the current strained relationship between Canada and China and capital control by China are not helping the Greater Vancouver housing market.


Presale condo developments have slowed down significantly due to slower sales and many new projects were on hold and deferred from going foward with their sales launches. The impact of new condos completing where buyers are required to take possession is yet to be fully assessed.


Will more new condos buyers who are taking possession of their condos rent out their units, or choose to sell them in the open market? The full impact of these new condos are yet to be played out. We should be able to know the new listings coming into the market from January 2020 onwards.


If you are planning to buy or sell your home, you are welcome to contact us for a discussion. Whether you should be buying or selling? Or, whether to wait to find out how the market will turn out this comoing spring 2020.


Return to Homepage.

Read

Metro Vancouver September Housing Report

Metro Vancouver September, 2019  Housing Report


Home buyer demand has returned to more historically typical levels in Metro Vancouver* over the last three months.

The Real Estate Board of Greater Vancouver (REBGV) reports that residential home sales in the region totalled 2,333 in September 2019, a 46.3% compared to September 2018. Last month’s sales were 1.7% below the 10 years average.


The Metro Vancouver market were more balanced over the past 3 months compared to a similar period a year ago. Both townhouses and condos were seeign more buying activities.


Current Listings


- There were 4,866 total new listings (detached, attached and apartment) for the month - decline of 7.8% compared to a year ago.
- This epresented a 29.9% increase compared to August 2019.
- The toal numbr of homes listed for sale on the MLS® system in Metro Vancouver is 13,439.
- The sales-to-active listings ratio for all the properties combined was at 17.4%. By property type, the ratio was 12.7 % for detached homes, 18.9% for townhomes, and 21.9% for apartments.

Sales-toactive Listings Ratio

Detached homes12.7%

Townhomes18.9%
Condominiums21.9%
Total 17.4 %


Generally, over several months, downward pressure on home prices happens when the ratio dips below 12%, while at 20% or more, home prices often experience upward pressure.

MLS® Benchmark Home Price

- All residential homes in Metro Vancouver at $990,600 was 7.3% decline year-ovr-year.
- Detached home at $1,406,200 was 8.6% .
- Townhouses at $767,500 was 7.2% decline year-ovr-year
- Apartment property at $651,500 was 6.5 decline year-ovr-year


Note: Metro Vancouver Areas covered by the REBGV include: Burnaby, Coquitlam, Maple Ridge, New Westminster, North Vancouver, Pitt Meadows, Port Coquitlam, Port Moody, Richmond, South Delta, Squamish, Sunshine Coast, Vancouver, West Vancouver, and Whistler.

Read

May Sees Modest Increase In Home Sales

The Real Estate Board of Greater Vancouver (REBGV) May's housing report showed:


  • residential home sales in the region totalled 2,638, a 6.9% decrease from the 2,833 sales recorded in May 2018
  • It was 44.2% higher than the 1,829 homes sold in April 2019.
Total home sales for the month were 22.9% below the 10-year May sales average, and was the lowest total for the month since 2000.

Ashley Smith, REBGV president cited "High home prices and mortgage qualification issues caused by the federal government’s B20 stress test remain significant factors behind the reduced demand that the market is experiencing today"


Although new listings were added at slightly higher level than the month before, slower sales continued to add to the total listings. 

Sales-to-active Listings Ratio

  • For all property types: the ratio for May 2019 was 18%.
  • For detached homes the ratio was 14.2%
  • For townhomes it was 20% and 21.2% for condos/apartments.

Generally, analysts say downward pressure on home prices occurs when the ratio dips below 12 per cent for a sustained period, while home prices often experience upward pressure when it surpasses 20 per cent over several months.

HPI Benchmark Price

The recent months rate of price decline appeared to have slowed, partly due to many home sellers deciding to withhold their homes homes for sale. The more orderly decline in home prices in the past few months provided some confidence and hope to home sellers that the market may hold the home prices at currrent levels.


Now that the seasonally peak home buying and selling period had passed, the slower sales pace for July to September could add many more homes to the current supply, causing another round of price decline from late autumn to the end of January, 2020.


We will continue to monitor the market and report back on the housing market activities in the second half of 2019.


Related Links:


Housing Market Outlook 2019 And Beyond

Metro Vancouver Housing Report - April 2019

Greater Vancouver Housing Market Update - February, 2019
REBGV & FVREB Housing Market Outlook: 2019 - 2021

Home Sales Were 25% Below 10-year Sales Average

Stress Tests Disqualifying 18% of Canadian Home Buyers
Global Assets: Greater Vancouver Real Estate


Read

Housing Market Outlook 2019 And Beyond

Home Sales Outlook

The REBGV rolling 12-month home sales as shown on the chart below for Greater Vancouver and Fraser Valley showed worsening housing markets since 2016. Home sales since the middle of 2018 had crashed below the10-year average sale, and there are few signs of buyers getting back into the market. The fundamental shift in housing demand since 2016 has a major impact on the housing markets in the lower mainland of Vancouver and Fraser Valley.


Until housing market sentiment becomes more conducive and the many constraints on buyers become more favourable, home sales are expected to remain low for some time. Home sales for the second half of 2019 will provide a clearer picture as when a rebound in home buying activities will resume. If the decline in home prices is gradual, the recovery in sales may be delayed and dragged on for 2 or more years. 


Average Days-on-market

Based on the chart below, the current average days-on-market is around 35 days. The current housing market cycle and market dynamics for the Greater Vancouver and Fraser Valley will likely take up to early 2020 before the days-on-market reaches the 10-year average of 48 days.


However, the days-on-market may over shoot and pushed up to 60 days before pricing pressure causes more sellers to sell their homes at lower prices to push the days-on-market back to its average figure.


HPI Home Price Outlook

The Canadian Federal and Provincial Governments appear to have set their sight on guiding the housing market and make home prices to a more affordable level. At current rate of price decline, home prices will have to decline more over a longer period before reaching the long term price levels sometime around the middle of 2021.


If the rolling 12 months HPI price projections for Greater Vancouver and Fraser Valley were to follow the rates of decline as shown on the chart below, the HPI price decline would represent 22% and 25% respectively from their peak HPI prices of 2018.


It may take another 2 years of low housing activities and lower home prices before buying interest returns to boost home sale to levels above the 10 years sale averages of 2,500 units and 1,350 units respectively for the Greater Vancouver and Fraser Valley markets. 


Related Links:


Metro Vancouver Housing Report - April 2019

Greater Vancouver Housing Market Update - February, 2019
REBGV & FVREB Housing Market Outlook: 2019 - 2021

Home Sales Were 25% Below 10-year Sales Average

Stress Tests Disqualifying 18% of Canadian Home Buyers
Global Assets: Greater Vancouver Real Estate
November Home Sales Down 42.5%


Return to homepage.


Disclaimer: The owner of this website assumes no liability whatsoever, for errors and/or omissions and any consequences arising either directly or indirectly from the use of information provided by this website. Any data provided are strictly for guidance and planning purposes only and may not be applicable due to ever changing market dynamics.

Read

Metro Vancouver Housing Market Report - April 2019


Housing trend - reduced demand and increased supply


The Real Estate Board of Greater Vancouver (REBGV) reported that residential home sales in the region totalled 1,829 in April 2019, a 29.1% decrease from the 2,579 sales recorded in April 2018, and a 5.9 % increase from the 1,727 homes sold in March 2019.


April's sales were 43.1% below the 10-year April sales average.


"The federal government’s mortgage stress test has reduced buyers’ purchasing power by about 20 per cent, which is causing people at the entry-level side of the market to struggle to secure financing."


The total number of homes currently listed for sale on the MLS® in Metro Vancouver was 14,357, a 46.2% increase compared to April 2018 (9,822) and a 12.4 per cent increase compared to March 2019 (12,774).


The overall sales-to-active listings ratio for April 2019 was 12.7%:


  • Detached homes - 9.4 %
  • Townhomes - 15.4%
  • Condominiums - 15.3 %


Generally, analysts say downward pressure on home prices occurs when the ratio dips below 12 per cent for a sustained period, while home prices often experience upward pressure when it surpasses 20 per cent over several months.


metro Vancouver housing price chart


The MLS® Home Price Index composite benchmark price for all residential properties in Metro Vancouver was at $1,008,400, a 8.5% decline compared to April 2018, and a 0.3% decline compared to March 2019.


- Detached home sales totalled 586 was 27.4% lower than 807 recorded April 2018. The benchmark price at $1,425,200 was 11.1% decline compared to April 2018, and 0.8% deccine compared to March 2019.


- Apartment home sales totalled 885 in April 2019, a 32.3% decrease compared to the 1,308 sales in April 2018. The benchmark price of an apartment at $656,900 was 6.9% decrease from April 2018 and is unchanged from March 2019.


- Attached home sales totalled 358 in April 2019, a 22.8% decrease compared to the 464 sales in April 2018. The benchmark price of an attached home at $783,300 was 7.5$ decrease from April 2018 and was unchanged from March 2019.


Related Links:


Greater Vancouver Housing Market Update - February, 2019
REBGV & FVREB Housing Market Outlook: 2019 - 2021

Home Sales Were 25% Below 10-year Sales Average

Stress Tests Disqualifying 18% of Canadian Home Buyers
Global Assets: Greater Vancouver Real Estate
November Home Sales Down 42.5%


Return tohomepage.


Read

Declining Home Sales

The current depressed home sales due to multitude of factors will result in the rapid increase in supply of homes and  the build up of pricing pressure on home prices. The current market is the reverse of 2015 to 2017 when the supply of homes was low causing double digit gains in prices from 2015 to 2017.


Greater Vancouver home sales


The continued drop in home sales in Greater Vancouver and Fraser Valley during the first 4 months of 2019 is expected to exert pressure on home prices. While home sales have already dropped from its peak in 2016, sales may remain depressed due to:

  • Severely unaffordable home prices that few local residents can afford to buy.
  • Stress test limiting the number of buyers able to get the financing they need for their home purchases.
  • Difficulties in mainland Chinese buyers getting their funds out of China for home purchases.
  • Buyers waiting on the sideline as most are expecting home prices to go lower. 


Greater Vancouver housing listings inventory


Money laundering drove up B.C. real estate prices by 5%: reports

An estimated $5.3 billion of laundered money into B.C. real estate in 2018 hiked housing prices 5 per cent, two special reports released Thursday by the provincial government show. Right now we have an estimate of the amount of money that went in over a single year.


There’s been a 70 per cent increase in property value over a three-year period in the Greater Vancouver region. The impact of money laundering on specific regions, such as Greater Vancouver, could be much higher.

HPI Price Projection

The long term home price growth for Greater Vancouver is as illustrated by the upward slopping red-colour price channel. The green price line showed the rolling 12-month HPI price, and the price just rolled over in 2018. Detached home prices already reported to have dropped more than 11% year-over-year, townhouses 7.5% and condos 6.9%. 


If the price decline follows a steeper decline as shown in (1), the HPI home price will reach the long term price channel sometime around 2021 and 2022 and if the HPI price decline is more gradual, it will reach the support channel in late 2022 and 2023.


The current slow housing market is likely to be drawn out for a few years as the housing demand problem in Greater Vancouver area cannot be resolved in a few short years. A more normal and orderly market will result in a more significant decline in home prices that are currently severely unaffordable. A recent report cited "Average Vancouver home prices could lose $100,000 from 2018 peak".


Related Links:


Metro Vancouver Housing Market Report - April 2019
Greater Vancouver Housing Market Outlook

Greater Vancouver Housing Market Update - February, 2019

REBGV & FVREB Housing Market Outlook: 2019 - 2021

Home Sales Were 25% Below 10-year Sales Average

Stress Tests Disqualifying 18% of Canadian Home Buyers
Global Assets: Greater Vancouver Real Estate


Return to homepage.

Read

Housing Market Outlook For 2019


The soft housing market of 2018 continued into the first 2 months of 2019, posting total home sales of 2,587 units which were 36% lower than the total home sales of 4,025 units for the same period a year ago.  


The decline in Canadian home sales during the credit crunch of 2017/2018 lasted just about a year, and rebound quickly. Home prices continued to climb and stalled briefly in the spring of 2010. Home prices in Greater Vancouver continued to march higher and peaked around the spring of 2011. 


REGBV home sales 2010 to 2018


Many of the detached home sellers cashed out when home sales slowed in 2011, 2012 and 2013. Lenders were cautioning their clients not to get into the market as they felt home prices had shot up too high and they feared that a correction was about to happen. Buying interest gained momentum and home sales and home prices marched higher due to strong buying interest and short supply of inventory. Home buyers continued to bid up home prices from 2013 to 2016 when demand far exceeded the supply of homes for sales.  


Market Exhaustion

Detached home reached their peak prices in early 2016 and home prices were range bound for the next 30 months. Finally in early May 2018, home prices dropped, when selling pressure continued to build up in the later part of 2018, and eventually the average detached home price crashed below $1.6 milion. There is a strong likelihood for the average detached home price to crash below $1.4 million. 


The recovery in home sales and the recovery in the demand for detached homes, townhouses and condos may take some time to play out. A bottom out process may drag out for a period of time as buyers are in no hurry to enter the market as they feel home prices are still high, and there are rooms for home prices to fall further.


It is anybody's guess as to whether detached home prices will stabalize at the $1.3 million or $1.2 million level. In a down cycle, market undergoes a period of consolidation that can take 2 to 3 years to bottom out. The housing market is facing strong headwinds that work negatively against the market: 


  1. Home prices are still very high and unaffordable.
  2.  Impact of China’s tightening of capital controls.
  3. The absence of marginal mainland Chinese buyers who played a big part in the housing market. 
  4. Higher interest rates compared to a few years ago.
  5. Tougher bank financing - stress test imposed by the government.
  6. Regulatory measures discouraging real estate speculation. 


Until market conditions become more favourable, home buyers will likely remain on the sideline for sometime. More supply of homes for sale and fewer homes sold will result in further increase in the inventory of homes for sale depressing home prices. Presale condos that are completing in 2019 will add selling pressure on resale condos and  presale new condos that are currently offered for sale to the public.


Related Links:


Greater Vancouver Housing Market Update - February, 2019
REBGV & FVREB Housing Market Outlook: 2019 - 2021

Home Sales Were 25% Below 10-year Sales Average

Stress Tests Disqualifying 18% of Canadian Home Buyers
Global Assets: Greater Vancouver Real Estate
November Home Sales Down 42.5%

Read

February Housing Market Report


The February Metro Vancouver housing market posted and increase in supply from home sellers and below average demand from home buyers.


The Real Estate Board of Greater Vancouver (REBGV) reported for the month that the regional residential home sales totalled 1,484 was 32.8% lower than the 2,207 sales recorded in February 2018, and 34.5% higher than the 1,103 homes sold a month ago.


Total sales for February 2019 were 42.5% below the average 10-year February sales.

REBGV Price Chart February 2019


Total MLS® listings of 3,892 for detached, attached and apartment properties for the month was 7.8% lower than February 2018, and 19.7% lower than the 4,848 homes listed in January 2019.


Total number of homes for sale on the MLS® system in Metro Vancouver at 11,590 units was 48.2% higher than a year ago, and 7.2% higher than January 2019's 10,808 active listings. Read the full report.


Danger Of New Condo Price Collapse 

The greatest risk to the housing market is expected to come from presale concrete-highrise new condos that were launched after 2017, particularly in cities like Burnaby, Richmond and Coquitlam. The average price per square feet for these presale condos rise from $650 to the high $800s. 

Danger of Presale New Construction Price collapse

Early presale condo buyers from 2011 to mid 2015 were the winners paying around $500 per square feet for their condos. These buyers made huge gains in their condo values when resale new condos just completed in 2018 and early 2019 were selling at $900 to $1,000 per square feet. 


Huge Challenges For Highrise Concrete Condos

The current batch of presale condos completing and ready for possession was preconstruction condos sold at $530 to $560 per square feet from mid 2015 to mid 2016. These buyers have sufficient price cushion to sell their units through assignments or after taking possession (paying gst on their new condos) and selling their condos at a profit.   


The current soft housing market may go through a multi-year price decline following larger than expected collapse in the total units of homes that were sold the past 12 months. Many of the early condo buyers and investors who bought from 2011 to late 2015, may choose to sell to cash out their gains. Market pressure from too many homes for sale and poor demand as a result of stringent financing requirements, speculation tax, etc can have an adverse effect on condo prices. 


A protraded price decline over 3 years or longer could possibly see condo sellers cashing out driving down condo prices in a declining housing market.  

Cash Flow Projection

Assuming a condo buyer of a 2-bedroom Richmond condo with around 880 sq ft paying $800 per square feet, would have cost the buyer $704,000. Af the buyer is providing 30% down payment ($211,200) and getting 70% financing, the mortgage payment for the $492,800 loan at 3.6% interest per annum would be around $2,492.00 a month. Assuming the strata fee is $450 a month and property tax is $2,250 a year, the cost to carry the loan is around $3,130 a month. The vacancy provision, cleanup/repairs and property management may add another $370 a month to the carrying cost, making this investment obligation closer to $3,500 a month.


At current market rent for a 2 bedroom around $2,500 a month, the investment produces a negative cash flow of $1,000 a month to the owner. The opportunity cost for the $211,200 down payment at 3.5% per annum is conservatively estimated to be around $616 a month. The condo investment would run a deficit just over $1,600 a month or $19,200 a year. The mortgage loan pay down is estimated to be around $14,400. 


Capital Gain Prospect


Buyers stay out of the market when it is still in decline.  Smart investors look for signs of the market turning around, and they are on the look out for good buying opportunities. For more up-to-date information on the market and good buying opportunities for unusual deals, kindly contact us at 604-721-4817 for a discussion.   

Read

 Housing Market Outlook

1) Home Sales


Total  home sales on the Multiple Listing Service for metro Vancouver for 2018 totaled 24,619 units was 31.6% lower than the 35,993 homes sold in 2017. The 2018 sales was the worst in 18 years, posting 25% below the region’s 10-year sales average.


  • massive injection of liquidity and easing of interest rates by central banks around the world after the 2007 to 2008 credit crunch lifted home sales. 
  • since 2016 with credit tightening and rising interest rate in recent months, home sales slowed down and dropped significantly from its peark in 2016.
  • 2019 home sales may stay flatline at 2018 level, and recover somewhat to 30,000 to 35,000 units for 2020 and 2021.

Vancouver home sales dropped significantly

Related Links:

Home Sales Were 25% Below 10-year Sales Average

Stress Tests Disqualifying 18% of Canadian Home Buyers
Global Assets: Greater Vancouver Real Estate
November Home Sales Down 42.5%


2) Housing Inventory


Slower home sales and addition of new supply of homes will continue in 2019 resulting in further build up in the number of homes for sale in the market.


  • slowing sales due to lack of buying interest and newly completed condos will add new home supply to the market.
  • the seasonal nature of home buying and selling is expected to produce the inventory patterns as shown in the chart below. 
  • the current cycle where more homes are added than the number of homes sold, will push up the supply of homes in Metro Vancouver to the 17,000 units level for 2019, and if the market remains sluggish, the 2020 peark supply may reach 20,000 units.

3) Home Price


The housing down turn cycle is in play and this will likely last for another 3 years to bottom out. Many factors dampening demand for housing are not expected to be eliminated or corrected in the short term. Almost all housing pundits were pointing their fingures on the collapse in home sales as a result of the B20 policy - stress testing the ability of home buyers to service their mortgage obligations. 


  • the stress test effectively removes about 20% of the loan amounts that borrowers can be approved under previous lending guidelines.
  • this effectively remove a large number of home buyers from getting the loan amounts they needed to buy their homes.
  • until market sentiment improves when home prices decline significantly, only then more buyers will return to the market. 
  • home prices have to reach a lower price level that makes rental returns attractive enough for investors to buy.

HPI home price is showing signs of weakness

How Low Home Prices Can Drop?


The pricing chart above showed that home prices overshot to the upside by a large margin. According to Mr. Dane Eitelan, an analyst at Eitel Economics, Vancouver's detached home price was predicted to drop 23% from its 2017 peak (over a period of 2 to 3 years) to bottom out in 2020 or 2021.


The current housing downturn will have to drop significantly towards the long term coloured price channels to make housing attractive to more home buyers. People are moving to Fraser Valley to find more affordable housing there. The influx of buyers to Fraser Valley, especially Surrey may help to caushion the decline and home prices may not fall as bad as in Metro Vancouver. 


Return to homepage.

Read

Home Sales Were 25% Below 10-year Sales Average 

According to the Real Estate Board of Greater Vancouver, after tallying the Metro Vancouver total home sales for the year, 2018 suffered the worst sales in 18 years. Total home sales were the lowest since 2000, and were 25% below the region’s 10-year sales average.


There were 24,619 sales of detached, attached and apartment properties on the Multiple Listing Service for 2018, a 31.6% lower than the 35,993 total sales in 2017.


The composite benchmark price for all residential homes in Metro was down 2.7 per cent to $1,032,400. The price of detached homes was down 7.8 per cent.


Over the past 6 months, condo prices declined 6.4%, and townhome prices decreased 5.3%. The indicator to watch for 2019 is "the supply of homes for sale"


Mortgage Stress Test - B20 Regulation

Canada's federal finance regulator has implemented mortgage rules as of January 1 2018, at a time when mortgage rates are on the rise. The Bank of Canada after hiking the overnight rate five times over the past six quarters, together with the stress testing, has added 3% to the qualifying rate for homebuyers.


The stress test has been commonly cited as one of the main causes of the Canadian housing market cooldown. The stress test is based on “the greater of the Bank of Canada’s five-year benchmark rate (currently 5.34 per cent), or the contract mortgage rate plus two percentage points.” The stress test effectively lowers the purchasing power of home buyers by about 20%.


There are speculations that policymakers may ease stress testing if the Canadian housing market continues on its downward trajectory this year.

Detached Home Values Sink

The spectacular rise in detached home prices peaked in 2016, is now on its way back down. Since early 2017, the dramatic changes in the real estate market had shifted into a buyer’s market, especially for detached homes and particularly for the priciest mansions in Greater Vancouver.


According to statistics released last week by BC Assessment, an average single-family home fell around 12 per cent in value in 12 months, from July 2017 to July 2018.


Related Links:

Stress Tests Disqualifying 18% of Canadian Home Buyers
Global Assets: Greater Vancouver Real Estate
November Home Sales Down 42.5%


The values for more expensive properties showed the biggest decline of 15% to 17%, according to data analyzed by Landcor Data Corp. North Shore News reported headline "Real estate values sink for detached homes in West Vancouver, North Vancouver" highlighted the housing market situation in the north shore of Vancouver


Since the July assessment date, Realtors say the market has continued to fall. "In some high-end West Vancouver neighbourhoods, houses have sold in the past few months for $1 million under their assessed values".

Presale condos Completion

Many presale projects will be completing soon. With over 40,000 homes coming on stream and due for completion, the stress test imposed for loan approval effectively reduces about 20% of the loan amounts new condo buyers can get to complete their purchases. The situation will arise that the presale condo buyers will be forced to come out with more money to cover the shortfall, or forced to sell their condos.


Vancouver preconstruction condos price collapse danger


There will likely be many such forced sales situations, selling through assignments of their contacts. If the market turns bad suddenly, many may be forced to sell at a loss or walk away and lose the deposits they paid for their presale condos.


Return to homepage.

Read

Tougher mortgage qualification rules are “unduly suppressing” home sales in Canada by disqualifying 18% of buyers who cannot pass the stress test despite being able to afford their preferred home, a new report concludes. Read the Globe and Mail article here.


We've got a material tightening in Canada's credit conditions that we haven't seen in a long time. Tight credit lending will take a lot of velocity out of the Greater Vancovuer and Fraser Valley housing markets that are in decline and look to be continuing into decline.


The OECD warned that Canada is at the top of advanced and emerging markets with the highest household debts, and we are experiencing an incremental interest rate hikes because of international cost of capital going up.


Bank of International Settlement/OECD Canadian Household Debts


The very tight due diligence and implementation of the Government's current stress test rules by Canadian Banks and higher interest rates have resulted in many borrowers not being approved for the loans they needed, or only approved for much lower amounts.

New Housing Supply

BCREA reported that there are nearly 44,000 new housing units under construction in Metro Vancouver, 60 per cent above the previous peak of 27,000 units recorded in 2008. In addition, approximately 24,000 housing starts are expected both this year and next in Metro Vancouver.


New housing supply Metro Vancouver

Financing For Presale New Condos

The new condos due for completion in Greater Vancouver and Fraser Valley are estimated to be around 12,000 units a year. Many of the concrete highrise condos sold in 2017 were reported to have been sold at prices from $1,000 to $1,200 per sq ft. And in 2018, many of the presale condos were sold at prices over $1,200 per sq ft.


presale condos new construction Vancouver


Many of the 2016 presale condos are due for completion now. It's these presale condo buyers which are probably the most likely facing a forced selling situation where, they've made a commitment a few years ago, on the expectation that they could borrow X amount of dollars. They can only get certain % of the values of their condos for financing, leaving them with a material shortfall.


For presale buyers not having access to capitals to cover the loan shortfalls, they will have to sell off their presale condos. They're leave with the difficult choice to stump up the extra cash, or sell their condos in a hurry at market prices which may not be favourable in a declining market. And if this happens en masse, forced selling, can have a very asymmetric outcome on markets and pricing.


Related Posts:


Housing Market Insight

October Home Sales Report - REBGV

Home Sales Dropped 43.5% In September


Read

Central Banks Balance Sheet Assets Versus Greater Vancouver Real Estate

Massive global credit expansion by the Central Banks around the world after the financial collapse in 2007 had a major impact on the asset prices for stocks, bonds and real estates around the world. 


Central Banks Balance Sheet Assets

Credit growth from 2006 to 2018 was a massive $17 trillions, representing over 440% increase over a 12 years period.


Greater Vancouver real estate price growth over the same period was around 272%, presenting a 22.7% growth each year for 12 years. Knowing the fact that the real estates around the world are directly affected by global credits and interest rates, close monitoring on credit growth and interest rates will help to foretell the performance of Greater Vancouver's housing market. 


Metro Vancouver price chart

BC Housing Measures

The early 2018 BC Government's housing policy measures include:

  • A speculation tax aimed at absentee property owners that was targeted at homeowners who don’t pay much income tax in B.C.
  • A hike to the foreign buyers’ tax from 15 to 20 per cent, and expanding it to areas including Victoria, Nanaimo, the Fraser Valley and the Okanagan
  • A property transfer tax (PTT) hike for homes worth more than $3 million
  • A registry that would record contract assignments in the pre-sale market

Detached home prices deteriorated further in 2018, and the market sentiment for townhouse and condo buyers turned sour during the second half of 2018.

Home Sales Versus Home Prices

Greater Vancouver Home Sales

When the rise in home prices for Greater Vancouver is compared to total home sales, the only time period when the price chart appeared to correspond to the price gain was from 2013 to 2016. Detached homes made huge price gains from 2009 to the end of 2017, while townhouses and condos made significant gains in values from 2015 to the middle of 2018.


REGBV home sales forecast 2019, 2020


The East Vancouver housing market is an early indicator for the general health of the housing market in the lower mainland of Vancouver. Total home sales may have reached its lowest level after suffering lower sales for 2.5 years.


Detached home prices had dropped about 8% compared to a year ago, and the outlook is not good for a quick turn around. The price gain for detached homes from 2013 to 2017 was an impressive 196%. The price decline for detached homes on the way down, if it is a moderate decline, could take the current price level lower by another 10% to 15%.


Townhouses and condos had so far suffered about 2% drop in value, compared to the previous month. Their prices were still about 2.5% higher than a year ago. However, if market sentiment continues to deteriorate, the lack of buying interest may result in townhouse and condo prices dropping 5% to 10% from current levels.


Related Posts:


Housing Market Insight

- October Home Sales Report - REBGV

- Home Sales Dropped 43.5% In September

Read


Total Metro Vancouver homes sales were down across all property types.

The Real Estate Board of Greater Vancouver (REBGV) reported that the regional residential home sales totalled 1,608 for Novermber were 42.5% lower than November 2017.


The total sales for the month were 34.7 per cent below the 10-year November sales average and it was the lowest sales for the month since 2008. Read the full report here.


The total number of homes listed for sale on the MLS® system in Metro Vancouver at 12,307 was a 40.7% increase compared to November 2017 (8,747), and a 5.2 per cent decrease compared to October 2018 (12,984).

The sales-to-active listings ratio for all property types, was 13.1%, with single family detached at 8.9% (Buyer market since June), 14.7% for townhomes, and 17.6% for apartments.


declining home sales and prices as shown by sales to active ratio declining


Generally, when the sales to actives ration is under 12%, pricing pressure favours home buyers, and when the ratio is above 20%, pricing pressure favours sellers. The market is in balance between 12% and 20% sales to actives ratio.

Average Days On Market

The longer the average days on market, the more pricing pressure on sellers and the weaker they can hold on to their selling prices. The increasing number of days from 30 to 40 weakens sellers bargaining power. If the number of days increases further from 40 to 50 days or higher, the market gets from bad to worse for home sellers.


Average days on market all property types

Home Prices Are Rolling Over

Greater Vancouver Price Chart price trending lower


Home prices had declined between 4% to 7% over the last six months depending on property type. The possibility for further price decline is real, as home prices had gone up too high and too fast the past few years. According to Mr. Dane Eitelan, an analyst at Eitel Economics, Vancouver's detached home price was predicted to drop 23% from its 2017 peak (over a period of 2 to 3 years) to bottom out in 2020 or 2021.


Higher interest rates and tightened lending standards had dampened home sales, as many buyers became more cautious and held off their decisions to buy.

High Housing Price Problem

Home buyers from outside Canada have a major impact on house prices in the major Canadian cities like Toronto and Vancouver. These are outliers, or "marginal buyer" - Buyers who are paying huge premiums over the "consensus price" based on previous sales of comparable homes.


Europeans are interested in purchasing real estate in Toronto, because it's close to New York and it's a relatively easy hop across the Atlantic. In Vancouver, these marginal buyers, mostly from mainland China were fueling the rise in home prices the past 10 years. Cash from overseas by these marginal buyers were pushing up home sales and prices. Most of these buyers are rich and successful businessmen in their home countries. They continue to maintain their businesses and homes overseas, while their spouses and/or sometimes just their children are studying in Canada.

Local Home Buyers' Dilemma

Many local home buyers' "fear of missing out", left them with no choice but to join the bidding war during the hot housing market, when homes were selling within days with multiple offers.They just couldn't wait for home prices to come down as the continuous rise in home prices the past 10 years prompted them to enter the market as "they don't want to be left out not buying their homes before home prices go up further". 


Canadian household debt is growing so fast, we’re in uncharted, and dangerous territory. The household debt-to-income ratio by the second quarter of 2018 was reported to have reached 169.1%Most home owners would not have the financial means to deal with a reduction in their household incomes or any unexpected high financial obligations.  


source: tradingeconomics.com


Beside higher interest risk, a drop in home prices in Vancouver could put many home owners who bought their homes during the past 3 years into serious financial troubles. 


Related Posts:


Housing Market Insight

- October Home Sales Report - REBGV

- Home Sales Dropped 43.5% In September

Read

Housing Market Insight

REBGV October home sales dropped 35%, inventory increased
42%…

Is this dip in price a blip, a soft landing, or the bursting of a bubble?


The Real Estate Board of Greater Vancouver home sales data showed a drop of 35% to 1,966 in October compared to the 3,022 sales recorded a year ago. Total sales for the month showed a 23% rebound from 1,595 sales recorded the previous month. Read the full report here.


Home sales via Canadian MLS® Systems edged back by 1.6% in October 2018. Although activity was stronger compared to the first half of 2018, it remained below monthly levels recorded since early 2014. Total Greater Vancouver home sales had been in decline since 2015, with each successive year posting weaker sales. 2018 is expected to register much lower home sales than 2017 for Greater Vancouver and the Fraser Valley.


Greater Vancouver Housing Market

Rising interest rates have prompted the Federal Government pushing for tighter credit standards and Canadian banks adopting more stringent under-writing conditions for home loan applications. The stress testing imposed by Canada’s banking regulator had resulted in many borrowers not able to qualify for the loans they needed for their home purchases.


After reaching peak sales of 42,326 units in 2015, buying interest for Greater Vancouver detached homes took a dive, taking sales down 15% and 21% in 2016 and 2017 respectively. Adding the projected November and December sales of 1,142 units to January to October 2018 total sales of 6,678 homes, 2018 would record 7,820* homes sold, representing 32% fewer detached homes sold compared to 2017. Multi-family townhomes and condos are experiencing slower sales, with both showing accelerated sales decline in the second half of 2018. 

*projection by addding 2 months sales of 1,142 homes (average monthly sale based on August, September and October sales of 567, 508 and 637 homes respectively). 

Greater Vancovuer detached home sales 2007 to 2018

Home Prices Are Weakening

Higher mortgage rates combined with BC government’s housing policies for non-residents and vacancy tax, have resulted in total home sales tumbling to multiyear lows in Greater Vancouver and Fraser Valley. All the above factors have a negetive effect on home sales, resulting in higher supply and lower demand, thereby drving down home prices.


Vancouver Home Sales versus rising interest rates

Single family detached homes for Greater Vancouver had taken the lead in price decline the past 2 years. As of October 2018, its average price at $1,629,000 was 11% lower than its peak price of $1,829,000 reached in May 2017.


According to Mr. Dane Eitelan, an analyst at Eitel Economics, Vancouver's detached home price was predicted to drop 23% from its 2017 peak (over a period of 2 to 3 years) to bottom out in 2020 or 2021.


Multi-family townhome and condo prices are showing signs of rolling over, and if their sales continue to decline, they could follow the price decline as seen for detached homes.  

Bursting Of Vancouver's Housing Bubble?

The material tightening in credit conditions the past 12 months has already taken a lot of velocity out of the housing market that is in decline, and looks to be continuing into decline.


An analyst at Eitel Economics, using a technical-analysis technique commonly used for stock-market analysis was predicting a 23% drop in Vancouver's detached home price from its $1.83M peak to bottom out around $1.4M sometime in 2020 or 2021 (taking 2 to 3 years to hit the bottom of the housing downturn). Read the full article here.

Changes To China's Capitol Control Regulations

Effective January 2 2017, the People’s Bank of China (PBoC) and The State Administration of Foreign Exchange (SAFE) required their citizens exchanging currency greater than ¥200,000 (US$29,000) to provide a declaration to explain the acceptable use of the money. Exchanging currency is now prohibited for buying bonds, “insurance-type” products and real estate. The yearly limit to convert up to US$50,000 per year, per person remains.


New regulations now prohibit the exchange of yuan for real estate, making it tricky to get Chinese Yuan currency into foreign markets. Without Chinese yuan conversion, Chinese buyers won’t be able to continue driving home prices, and could have trouble paying for existing property.


New penalties for lying, or lending one's yearly allowance were also rolled where violators of the policies are now subject to a 3 year ban, and an investigation for money laundering - getting money out of China without an approved use.

Canadian Households Are Highly Indebted

According to the statistics compiled on OECD member countries, Canada has the highest household debt level as a per cent of GDP in the world. And, like every other advanced countries, we are going through incremental interest rate hikes because of higher international cost of capital.


Over-building Of New Condos?

MLA  Advisory, a real estate marketing company, released its most recent insight for Greater Vancouver’s presale housing market, highlighting October as a busy month with the release of 21 presale projects with 2,400 units, compared to October 2017 release of 22 projects with over 1,800 homes. View report here.


In a declining housing market and tightened lending standards, the flow of credit to the housing market is curtailed. Many marginal presale home buyers will have difficulties to get financinng to complete their purchases.


They may not be approved for the loans they needed, or they may be approved for much lower loan amounts for their purchases. These borrowers will have to make the difficult choice, either to stump up the extra cash if they have the excess money, or force to sell their presale homes in a hurry. If this happens en masse, presale home prices can spiral down very quickly.


Will the current dip in price just a blip, a soft landing, or the bursting of a bubble? We will see.

Read

REBGV Home Sales In October

The Real Estate Board of Greater Vancouver (REBGV) reported that residential home sales in the region totalled 1,966 in October 2018, a 34.9 per cent decrease from the 3,022 sales recorded in October 2017, and a 23.3 per cent increase compared to September 2018 when 1,595 homes sold.


Last month’s sales were 26.8 per cent below the 10-year October sales average. Read report here.

Declining Home Sales 

REBGC home sales OCt 2018

Total Greater Vancouver home sales as shown in the chart above, had been declining yearly since 2016 and 2018 sales could end up to be lower than 2008 and 2012. The remaining 2 months of 2018 for November and December, being seasonally low sales months, are not expected to add to many sales to the year.  


The total units of homes sold in the the Greater Vancouver area from January to October 2018 showed close to one-third drop in sales compared to the same period a year ago. The average detached home price for the month registered a decline of 5.1% compared to its price in October, 2017.


October 2018 REBGV home sales


Declining Home Prices

After turning flat-line or declining slightly for the second half of 2017 and the first half of 2018, detached home prices turned down and accelerated in its decline the past  3 months. Both townhouses and condos were showing weakening sales and demand, and October showed signs of decline in their prices. Kindly read the post Home Sales Dropped 43.5% In September.


The excessive credit injection into the housing market the past 10 years had driven home demand and prices to levels far exceeded the ability of home owners to carry their mortgage loan obigations.  

REGBV home sales prices are dropping 

Rising Interest Rates

Interest rates had spiked up considerbly since 2015. After the financial crash of 2008, interest rates were brought down to unpreceedingly low levels from 2009 to 2017.  Since the middle of 2017, the Bank of Canada's Overnight Rate had moved up gradually. Most economists are forecasting that Canada will have to deal with higher interest rates in the coming months.


Compared to the long-term equilibrium rate, the current Bank of Canada overnight rate is still very low. If rates climb another 100 basis points or more, many over-leveraged home owners will face considerable hardships to deal with their mortgage payments.  

Canadian Interest rate October 2018

10-year US Treasury Yield

The 10-year US Treasury yield broke theh 10 years down trend line (in red) and breached the 5 years treasury yield peak around 3%. Mortgage rates are closely linked to the 10-year yield. If the 10-year ticks higher, mortgage costs are going to go higher which will impact the housing market.


Real Estate Cycle

The Canadian housing market, especially detached homes peaked in 2016. Total home sales for 2017 was lower than 2016, and 2018 todate home sales were pointing to an all time low sales, probably lower than that of 2008. Declining detached home sales had resulted in motivated sellers dropping their prices.


Both the resale and presale multi-family markets for townhouses and condos were showing signs market cooling off the past few months. Many more townhomes and condos in recent months were selling below their asking prices compared to early part of the year. Motivated sellers were more willing to sell their homes at much larger discounts from their listing prices.   


We will continue to provide our housing market update to our readers in the coming months.  

Read


Home Sales Dropped 43.5% In September

The Real Estate Board of Greater Vancouver (REBGV) reports that residential property sales in the region totalled 1,595 in September 2018, a 43.5 per cent decrease from the 2,821 sales recorded in September 2017, and a 17.3 per cent decrease compared to August 2018 when 1,929 homes sold.

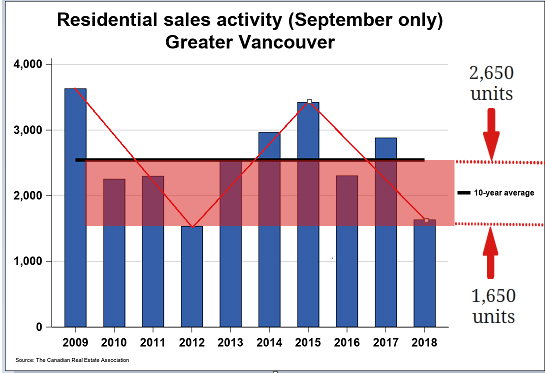
Last month’s sales were 36.1 per cent below the 10-year September sales average.

“Fewer home sales are allowing listings to accumulate and prices to ease across the Metro Vancouver housing market,” Ashley Smith, REBGV president-elect said.


The September Greater Vancouver home sales was below the 10 years average sale around 2,600 homes. Home sales peaked in spring of 2016 and finished the year with a total of 39,943 homes. Yearly home sales dropped from 2015's total of 42,326 to 39,943 and 35,993 in 2016 and 2017 respectively. The total 2018 home sales from January to September was 29% lower than that of 2017 when only 19,973 sales were registered for 2018 compared to 28,160 sales for the same period in 2017.


If the remaining 3 months of 2018 add another 6,657 homes to the todate sale figure, 2018 would end up with total home sale around 26,630 units which is around 24% lower than 2017's sales of 35,993 homes.  


September Metro Vancouver Home Sales

Rising Insterest Rates

The gradual rise in interest rates since October 2017 dampened home sales, especially single family detached homes. The demand for resale and presale townhouses and condos the past few months had slowed, but interest remain faily strong.


The tightening of mortgage qualification rules by Canadian Banks has a significant effect on home buyers ability to service their loans, thereby reducing the number of home buyer’s qualifying for mortgage loans.

HPI Benchmark Price

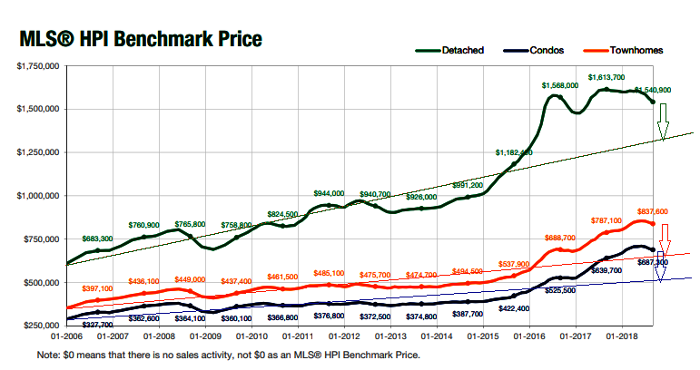
The HPI benchmark price for detached homes peaked in May, 2017. Both townhomes and condos reached their peak prices about a year later in July, 2018. The price trend lines for the 3 housing types are showing around 25% over-valuation. This means that home prices could risk substantial price declines if market sentiment turns bad, causing home buyers to stay away from the market. 


According to Mr. Dane Eitelan, an analyst at Eitel Economics, Vancouver's detached home price was predicted to drop 23% from its 2017 peak (over a period of 2 to 3 years) to bottom out in 2020 or 2021.

Housing Forecast For 2019

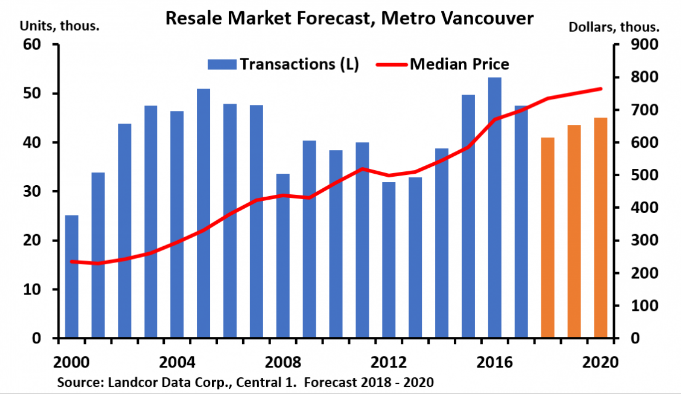
The British Columbia Real Estate Association is forecasting the housing market in 2019 to remain stable.  Multiple Listing Service (MLS®) residential sales in the province are forecasted to decline 21 per cent to 82,000 units for 2018 compared to 103,768 units sold in 2017, and recover 8% to 88,700 units in 2019.


REBGV is forecasting resale home sales for 2019 and 2020 to stay above 40,000 units.


REGBV home sales forecast 2019, 2020


We hope you will visit our website again soon to learn more about the Greater Vancouver real estate market.


Read

An analyst sees it happening…

Eitel Economics using a technical-analysis technique commonly used for stock-market analysis tracks data points and to predict future market trends.


According to the forecast, the peak price of $1.83 million for a Greater Vancouver detached home won’t be reached again for several years. This market peak price was touched three times — January 2016, February/March 2016, and May 2017.


“That signals a triple top, meaning that there is no momentum to carry that higher for the near-term future.” 


The forecaster, Mr. Dan Eitel suggests the market will bottom out in 2020 or 2021, with the average price of a detached home sinking to about $1.4 million. Read more…


A graphical presentation for Dan’s insight in HPI price is as shown in the chart below.


The long cooling period according to Eitel is attributes to the expanded stress testing introduced by Canadian banks for uninsured mortgage applicants. The author also figures the stress test will result in home owners who bought their homes at the market’s height, not able to re-qualify to renew their mortgages when they are due for renewal.


Mr. Benjamin Tal, Deputy Chief Economist, CIBC World Markets had a more optimistic outlook for the Canadian housing market. His comments on the housing market is presented in his videoCanada’s Housing Market – Tough Times Ahead?

Read
Reciprocity Logo The data relating to real estate on this website comes in part from the MLS® Reciprocity program of either the Greater Vancouver REALTORS® (GVR), the Fraser Valley Real Estate Board (FVREB) or the Chilliwack and District Real Estate Board (CADREB). Real estate listings held by participating real estate firms are marked with the MLS® logo and detailed information about the listing includes the name of the listing agent. This representation is based in whole or part on data generated by either the GVR, the FVREB or the CADREB which assumes no responsibility for its accuracy. The materials contained on this page may not be reproduced without the express written consent of either the GVR, the FVREB or the CADREB.